在进行差异基因表达分析时,得到显著差异基因后,接下来就需要分析这些基因参与了哪些功能,常见的就是GO功能注释和KEGG通路富集分析,今天就来介绍一下如何使用在线分析工具DAVID与KOBAS的进行KEGG通路富集分析。
操作步骤
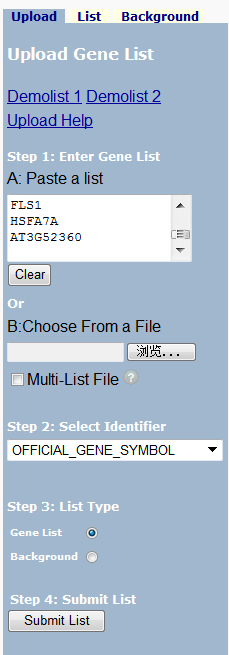
进入DAVIDhttps://david.ncifcrf.gov/conversion.jsp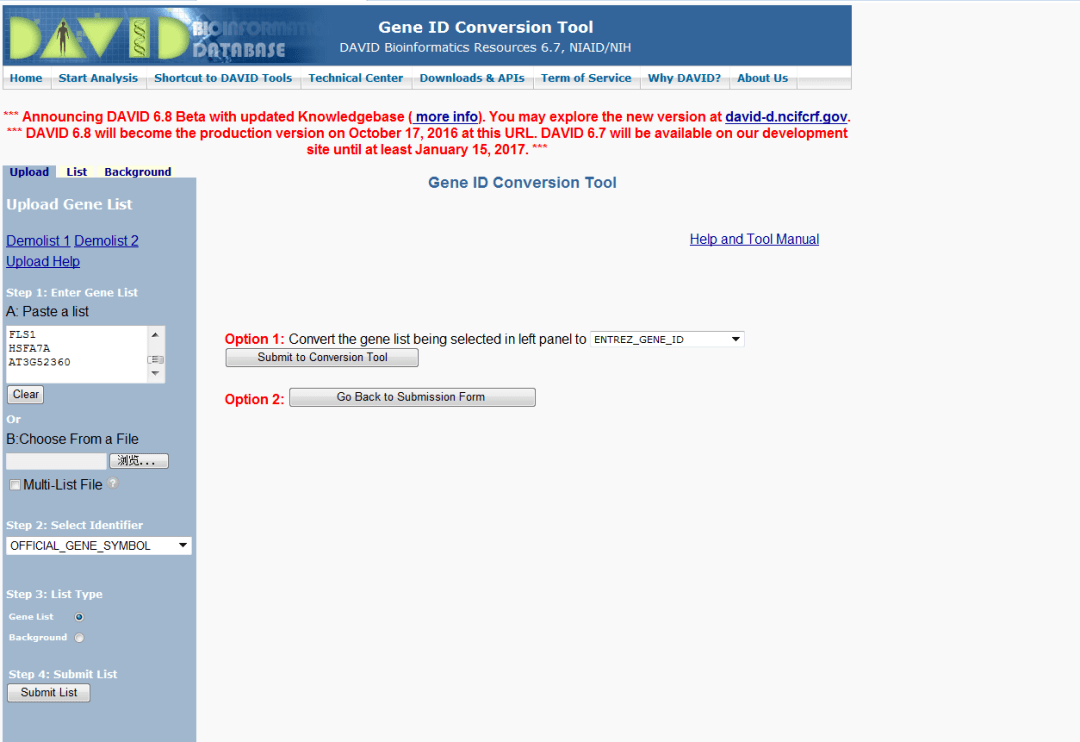 上传基因列表
选择物种
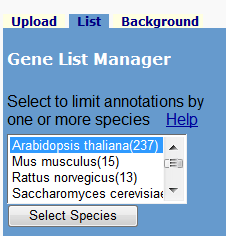
开始分析

选 择转换  选择格式,按照ENTREZ_GENE_ID
 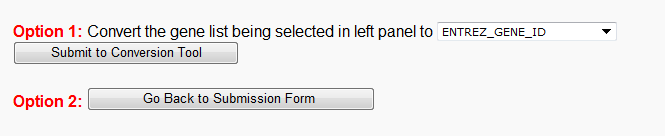 转换好了,下载结果
 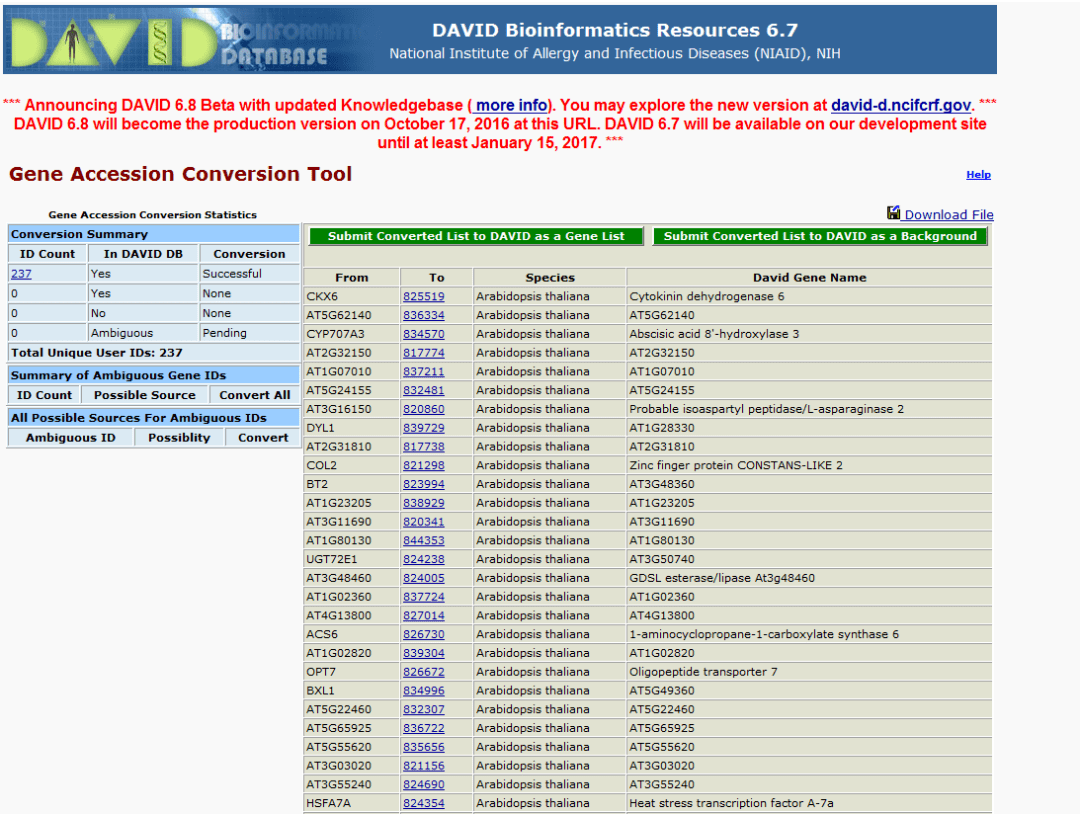 用excel打开
 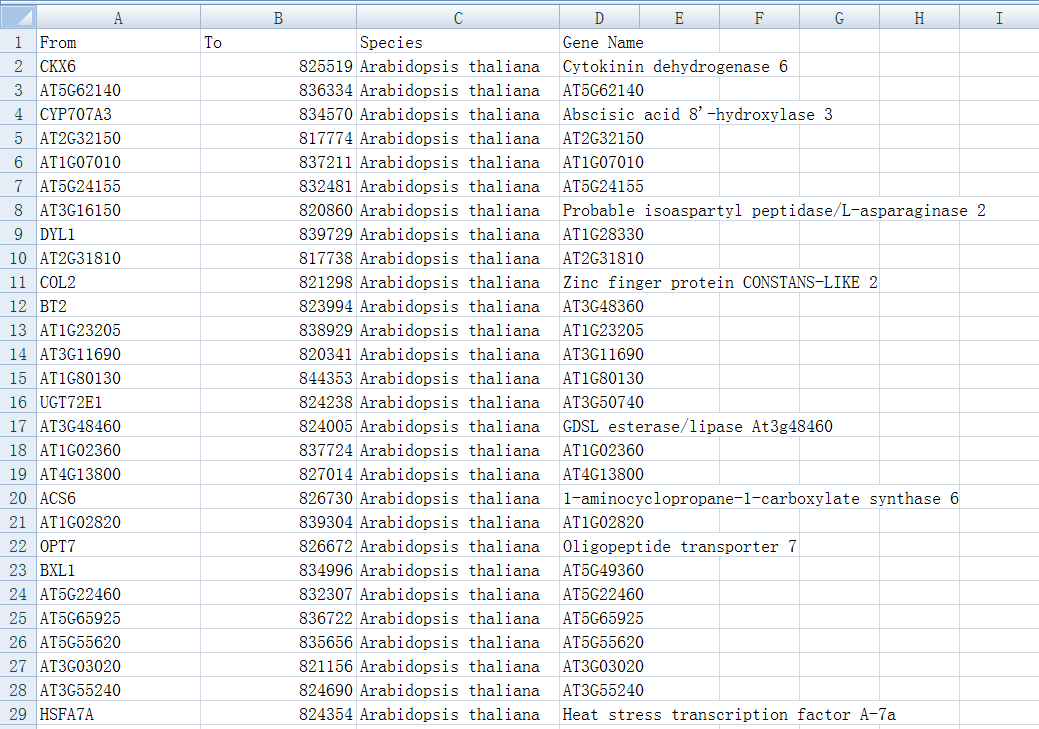 进入KOBAS http://kobas.cbi.pku.edu.cn/index.php http://kobas.cbi.pku.edu.cn/
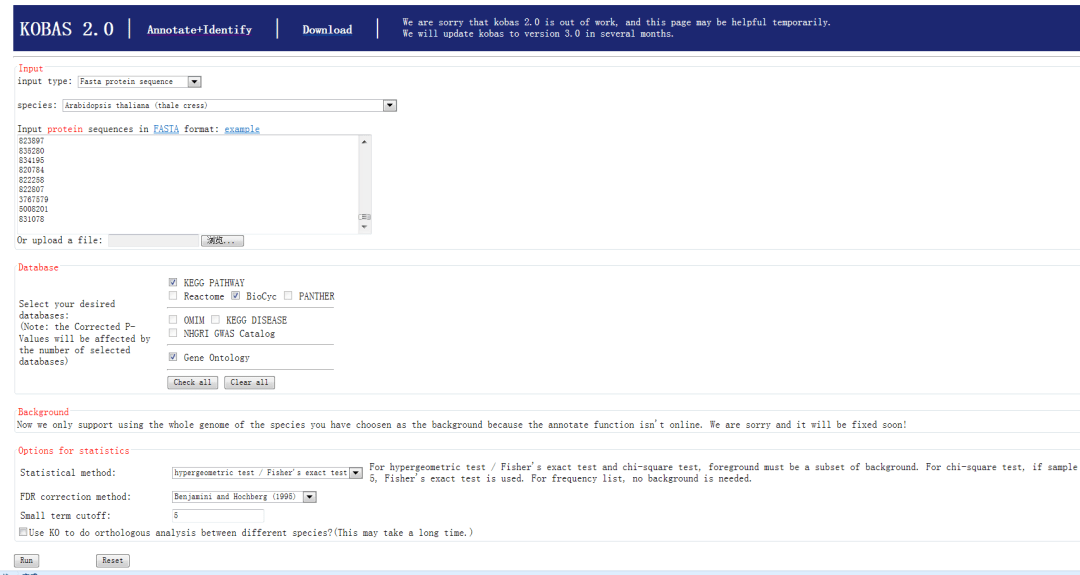 选择类型,选择物种,输入ID号
 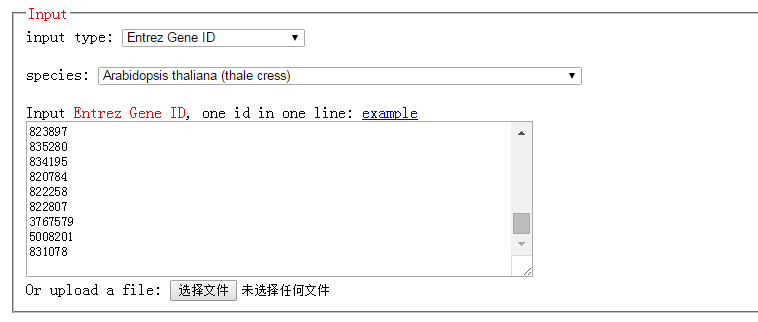 选择KEGG分析
 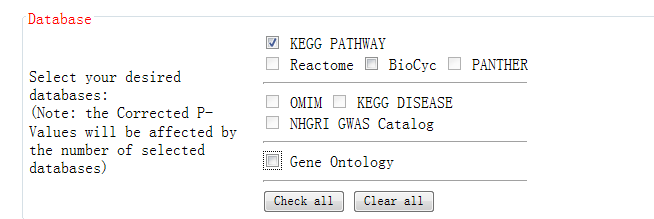 选择校正方法
 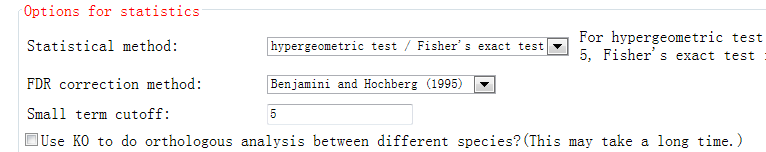 开始跑
开始跑

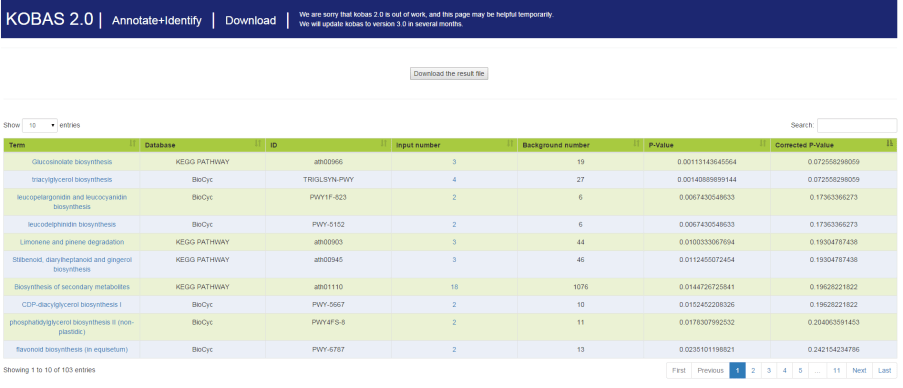 用excel打开,可以看到富集的通路,基因,以及校正值,还有网页链接
 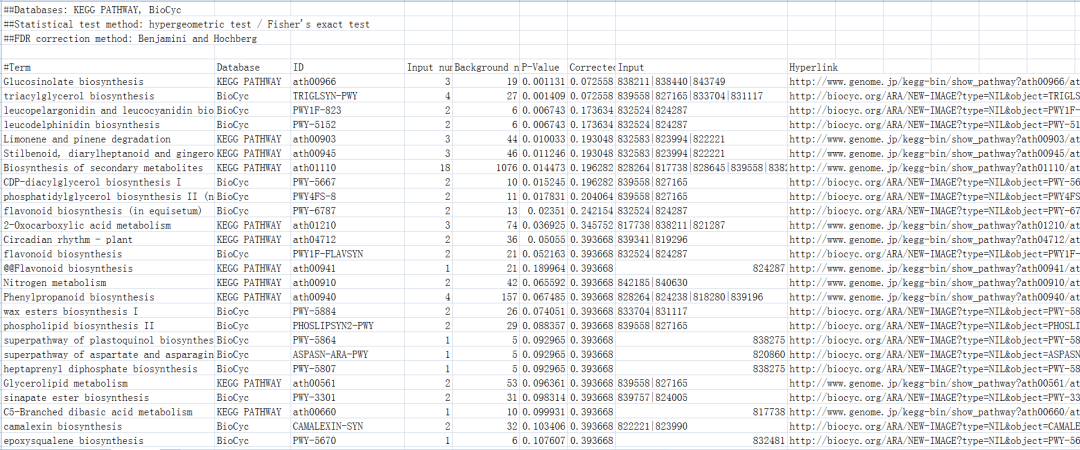 打开链接可以看到具体的通路
 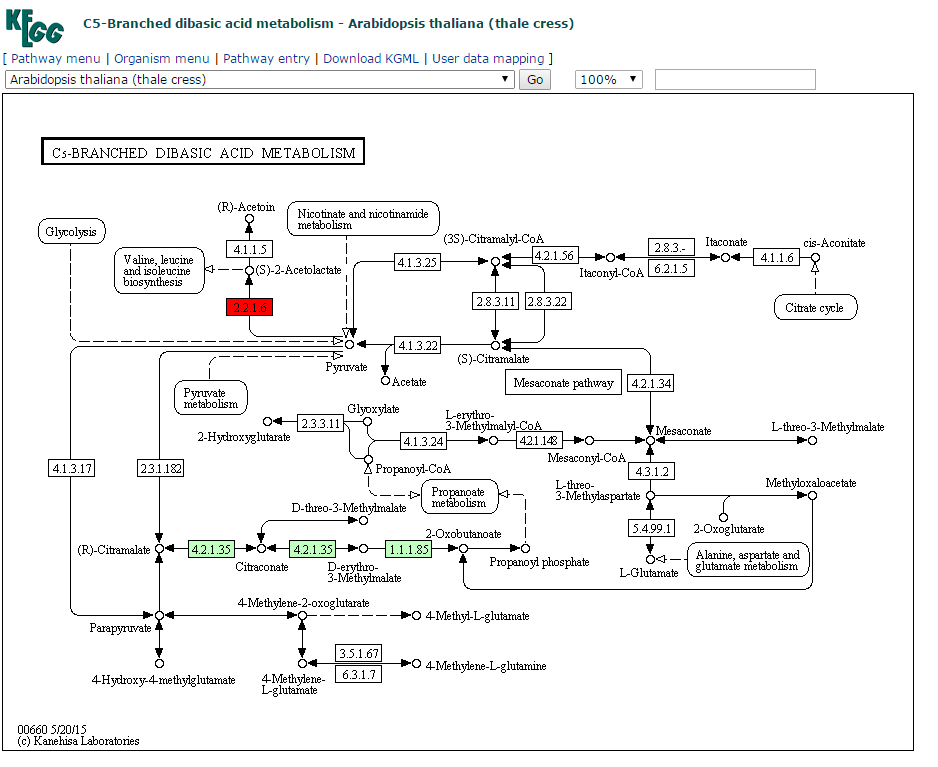 好了,以上就是使用DAVID和KOBAS进行KEGG通路富集分析的操作, 希望对你有所帮助。如果对操作 有什么问题欢迎评论区留言讨论。

画出漂亮的序列比对图,只差一个CGView
最优系统进化模型,用partitionfinder选选

让插图更有质感!用AI绘制细胞膜双分子层图

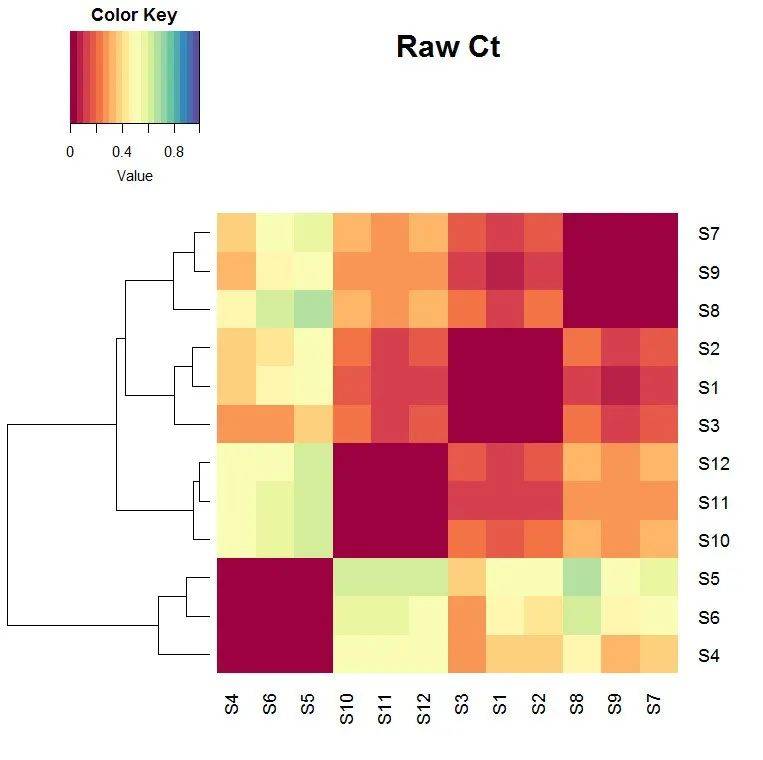
分析大量qPCR数据无从下手?试试R包吧
用ChIPseeker对ChIP-seq数据进行可视化,图表直观颜值高
2021-03-08
分析代谢组数据,大名鼎鼎的xcms来了!
- 本文固定链接: https://maimengkong.com/zu/903.html
- 转载请注明: : 萌小白 2022年5月3日 于 卖萌控的博客 发表
- 百度已收录