今天分享的是使用CAMERA对代谢物加和峰进行注释。下面我们就来介绍一下具体方法。
操作步骤#载入R包
library(CAMERA)
#单个样品
file <- system.file('mzdata/MM14.mzdata', package = "CAMERA") xs <- xcmsSet(file,method="centWave",ppm=30,peakwidth=c(5,10)) an <- xsAnnotate(xs)#根据保留时间校正
anF <- groupFWHM(an, perfwhm = 0.6)
#鉴定同位素
anI <- findIsotopes(anF, mzabs = 0.01)
#确认分组
anIC <- groupCorr(anI, cor_eic_th = 0.75)
#注释
anFA <- findAdducts(anIC, polarity="positive")
anFA
#展示EICs图
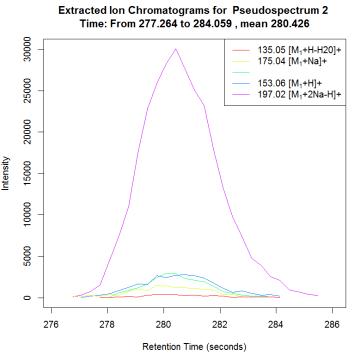
plotEICs(anFA, pspec=2, maxlabel=5)
#展示峰图
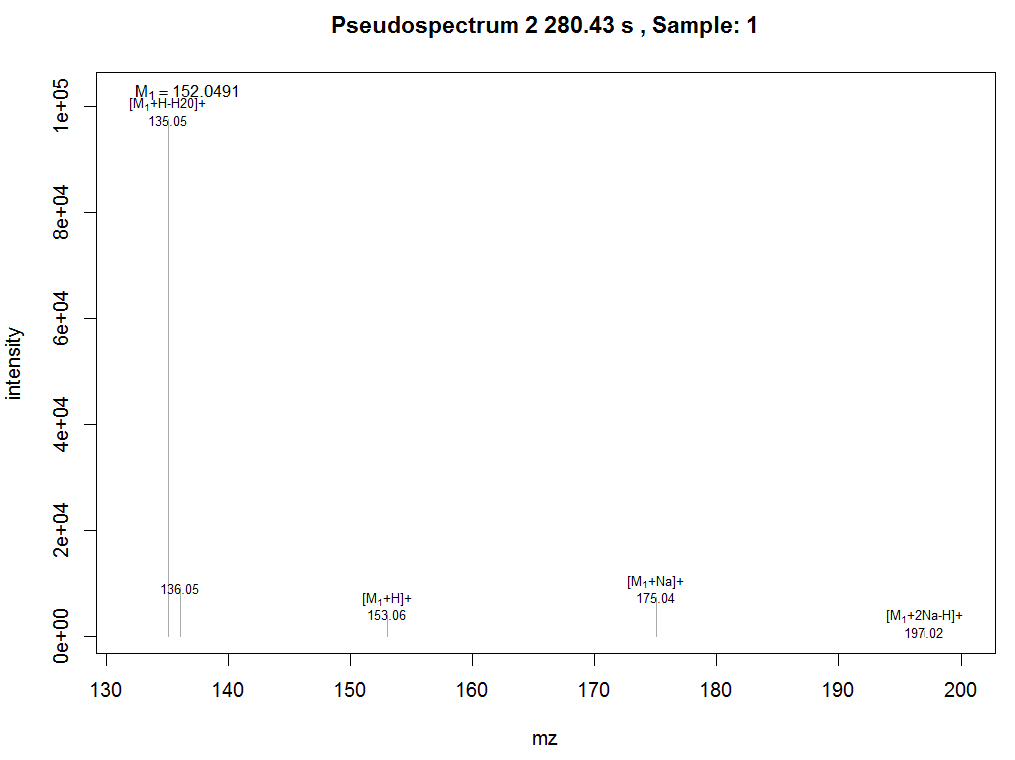
plotPsSpectrum(anFA, pspec=2, maxlabel=5)
#导出数据
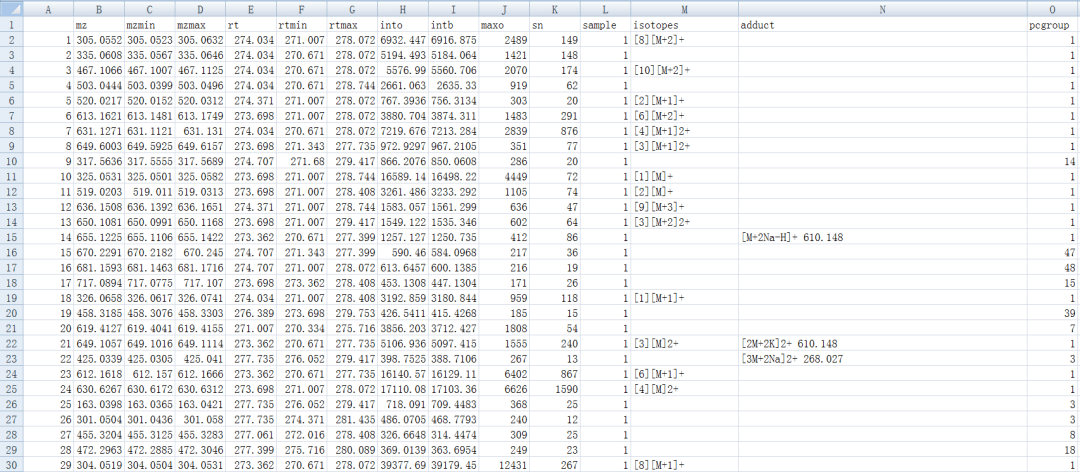
peaklist <- getPeaklist(anFA)write.csv(peaklist, file='xsannotated.csv')
#一次跑完上面的步骤
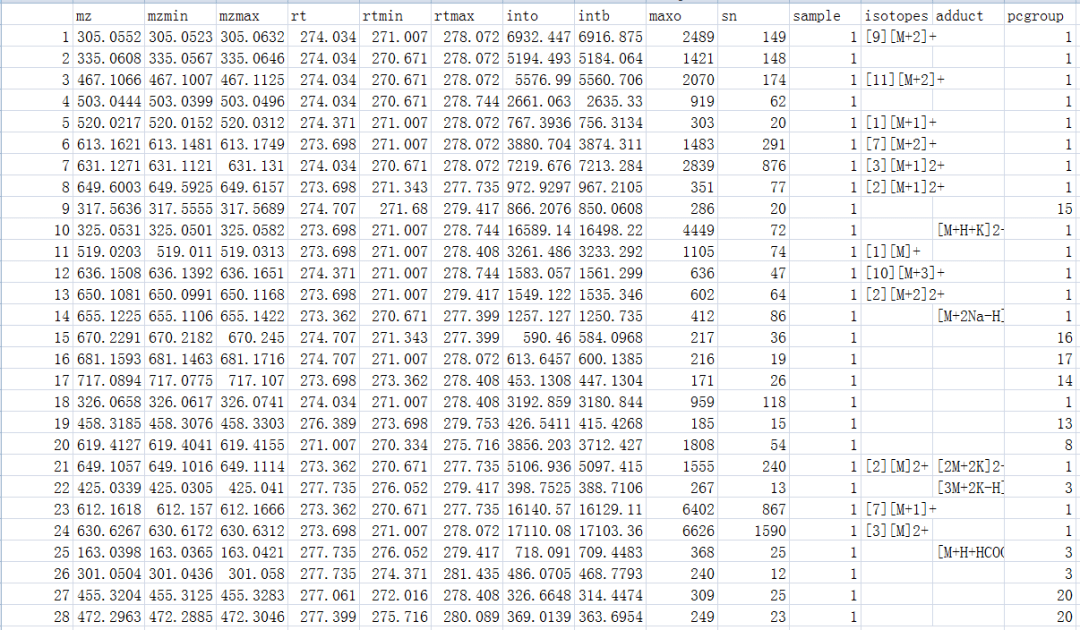
xsa <- annotate(xs, perfwhm=0.7, cor_eic_th=0.75,ppm=10, polarity="positive") peaklist <- getPeaklist(xsa) write.csv(peaklist,file="results.csv")
#多个样品
library(faahKO) filepath <- system.file("cdf", package = "faahKO") xsg <- group(faahko) xsg <- fillPeaks(xsg) xsa <- xsAnnotate(xsg)#根据保留时间校正
xsaF <- groupFWHM(xsa, perfwhm=0.6)
#确认分组
xsaC <- groupCorr(xsaF)
#鉴定同位素
xsaFI <- findIsotopes(xsaC)
#注释
xsaFA <- findAdducts(xsaFI, polarity="positive")
#导出数据
write.csv(getPeaklist(xsaFA),file="result_CAMERA.csv")
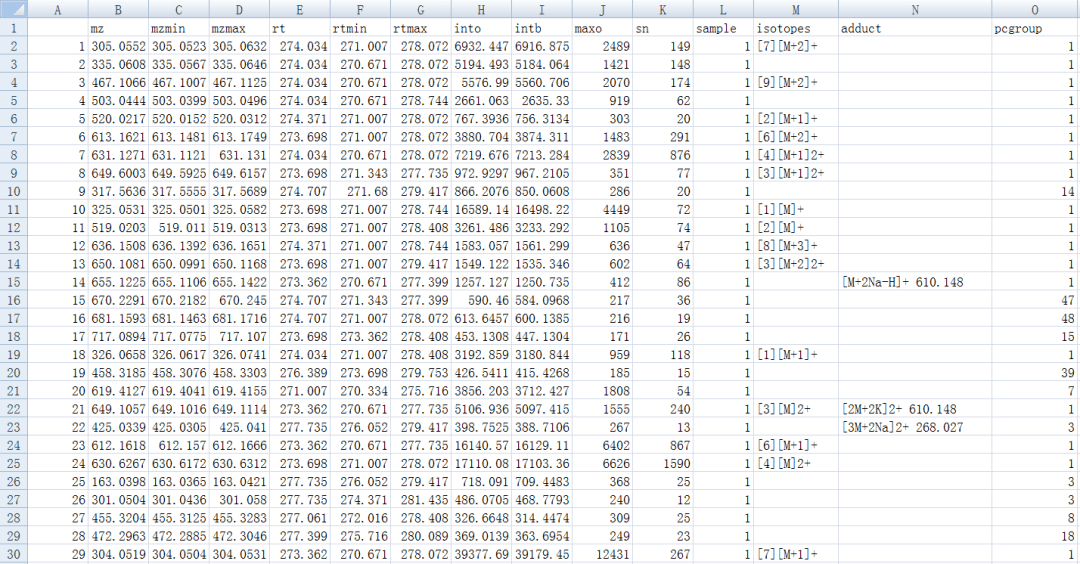
#一次跑完
xsg.fill <- fillPeaks(xsg)diffreport <- annotateDiffreport(xsg.fill)
write.csv(diffreport, file="diffreport.csv")
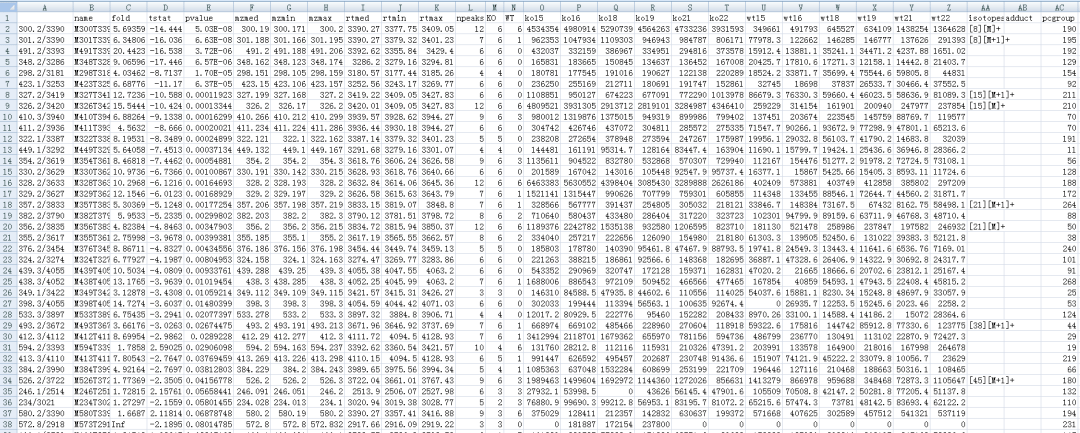
#创建一个感兴趣的列表
diffreport <- annotateDiffreport(xsg.fill, quick=TRUE) write.csv(diffreport, file="diffreport2.csv")#人工选定几个进行注释
psg_list <- c(10,11,30)diffreport.annotated <- annotateDiffreport(xsg.fill, psg_list=psg_list,polarity="positive")
#自动选择进行注释
diffreport.annotated <- annotateDiffreport(xsg.fill, fc_th=4,polarity="positive") 好了,以上就是使用CAMERA对代谢物加和峰进行注释的操作 。如果文章对你有所帮助,请转发给你身边需要的人噢!画出漂亮的序列比对图,只差一个CGView
最优系统进化模型,用partitionfinder选选
让插图更有质感!用AI绘制细胞膜双分子层图
分析大量qPCR数据无从下手?试试R包吧
用ChIPseeker对ChIP-seq数据进行可视化,图表直观颜值高
分析代谢组数据,大名鼎鼎的xcms来了!
- 本文固定链接: https://maimengkong.com/zu/911.html
- 转载请注明: : 萌小白 2022年5月9日 于 卖萌控的博客 发表
- 百度已收录
