爸妈: 今年不回来么?


1引言
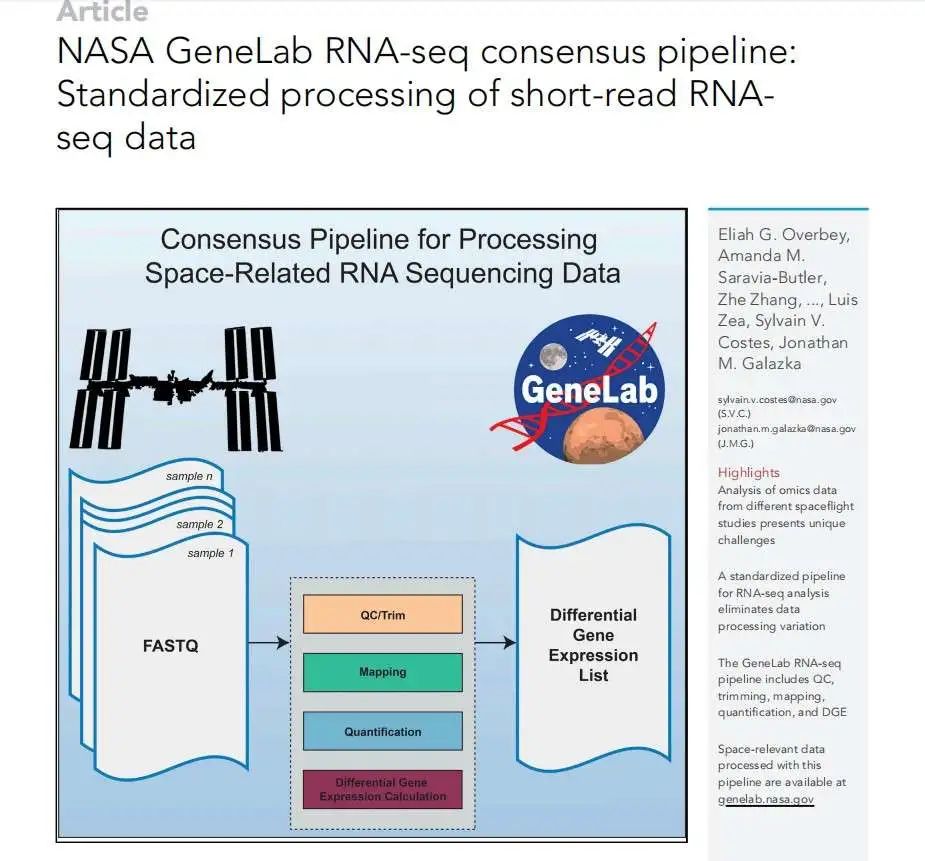
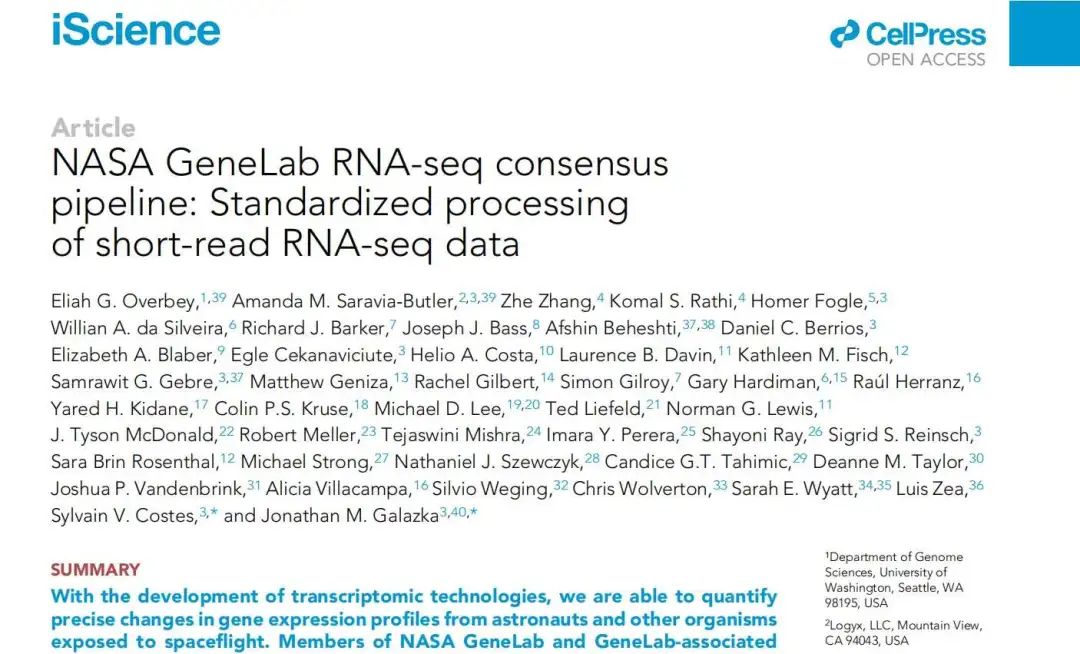
没错, 就是美国大名鼎鼎的航天局 NASA, 2021 年 4 月 23 日 在 iScience 期刊上发表了一篇处理 RNA-seq 数据的一篇文章。这篇文章提供了标准分析的一些代码,并且采用了 ENCODE 计划中的参考代码。
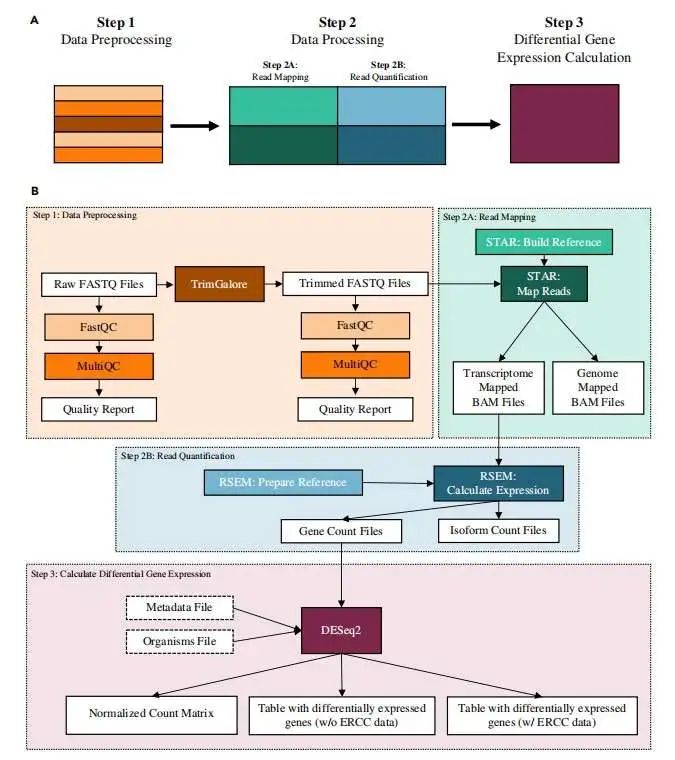
这个 pipeline 主要包括了 quality control, read trimming, mapping, gene quantification, detection of differentially expressed genes 等主要步骤, 大家可以借鉴学习。
航天局 NASA 主要是为了分析在太空中 不同条件下 的 不同模式物种 的测序数据, 提供了这样一个 pipeline。
2介绍
以下是整个流程示意图:
3步骤介绍
质控
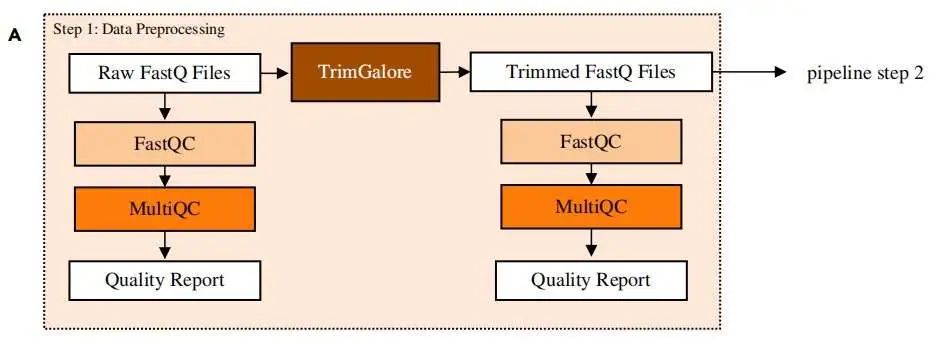
fastqc 代码及结果文件:

$ fastqc -o /path/to/output/directory           -t number_of_threads
         /path/to/input/files
multiqc 整合质控结果:

$ multiqc -o /path/to/output/directory /path/to/fastqc/output/files 接头去除
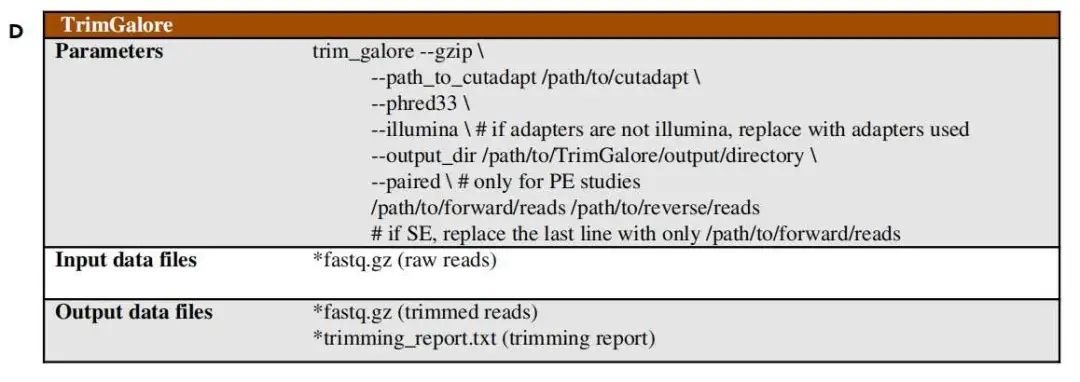
$ trim_galore --gzip                --path_to_cutadapt /path/to/cutadapt
              --phred33
              # if adapters are not illumina, replace with adapters used
              --illumina
              --output_dir /path/to/TrimGalore/output/directory
              # only for PE studies
              --paired
              # if SE, replace the last line with only /path/to/forward/reads
              /path/to/forward/reads /path/to/reverse/reads
比对
建立索引:
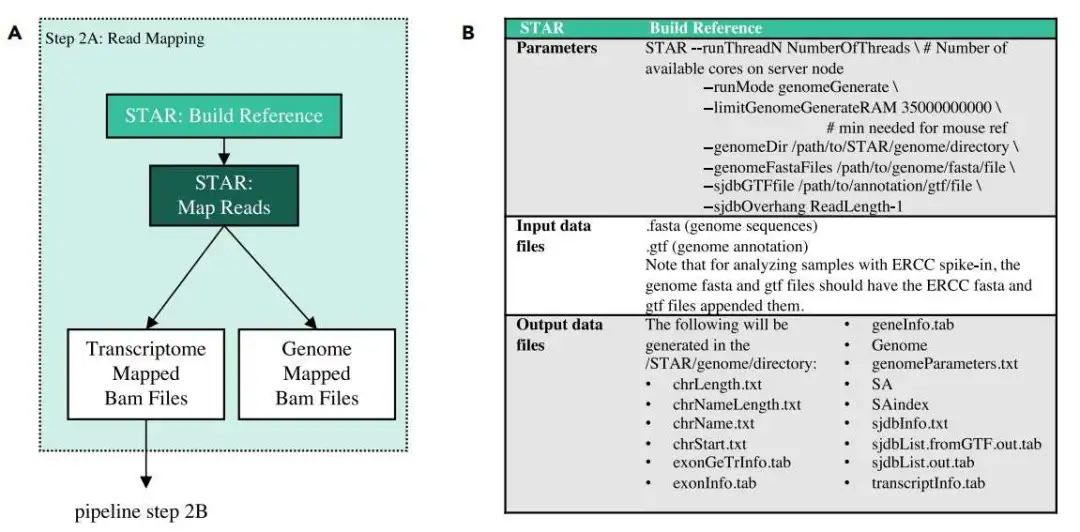
$ STAR  # Number of available cores on server node         --runThreadN NumberOfThreads
        --runMode genomeGenerate
        # min needed for mouse ref
        --1imitGenomeGcneratcRAM 35000000000
        --genomeDir /path/to/STAR/genome/directory
        --genomeFastaFiles /path/to/genome/fasta/file
        --sjdbGTFfile /path/to/annotation/gtf/file
        --sjdbOverhang ReadLength-1
比对:
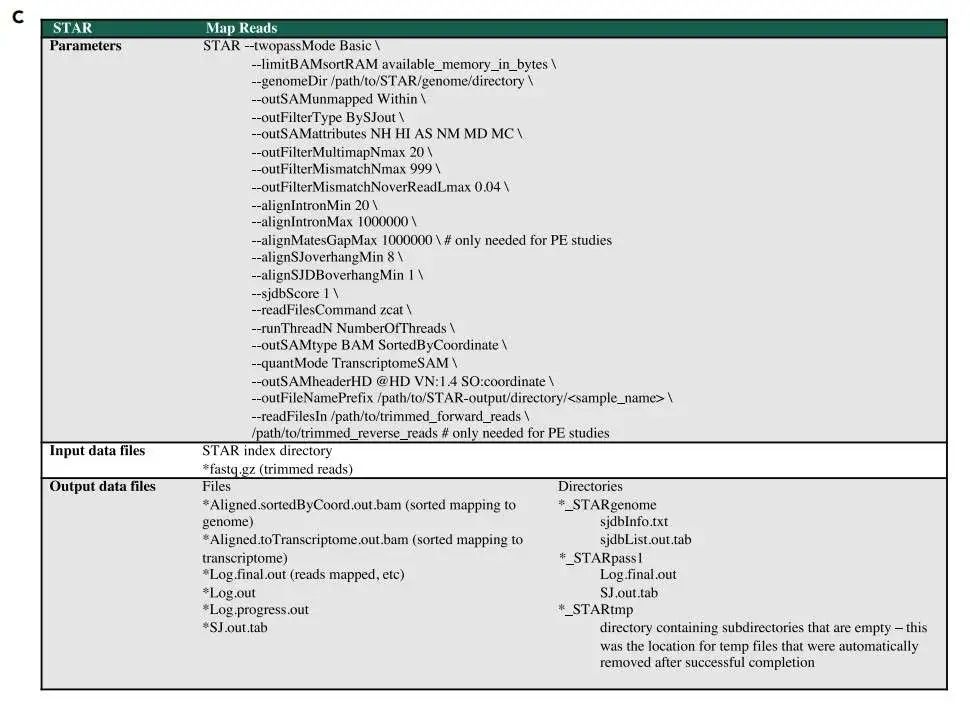
$ STAR  --twopassMode Basic          --limitBAMsortRAM available_memory_in_bytes
        --genomeDir /path/to/STAR/genome/directory
        --outSAMunmapped Within
        --outFilterType BySJout
        --outSAMattributes NH HI AS NM MD MC
        --outFilterMultimapNmax 20
        --outFilterMismatchNmax 999
        --outFiIterMismatchNoverReadLmax 0.04
        --alignlntronMin 20
        --alignlntronMax 1000000
        # only needed for PE studies
        --alignMatesGapMax 1000000
        --alignSJoverhangMin 8
        --alignSJDBoverhangMin 1
        --sjdbScore 1
        --readFilesCommand zcat
        --runThreadN NumberOfThreads
        --outSAMtype BAM SortedByCoordinate
        --quantMode TranscriptomeSAM
        --outSAMheaderHD @HD VN:1.4 SO:coordinate
        --outFileNamePrefix /path/to/STAR-output/directory/<sample_name>
        --readFilesIn /path/to/trimmed_forward_reads
        # only needed for PE studie
        path/to/trimmed reverse reads
定量
这里使用 RSEM 软件基于 比对到转录本的结果 bam 文件进行定量, 也就是 Aligned.toTranscriptome.out.bam 文件:
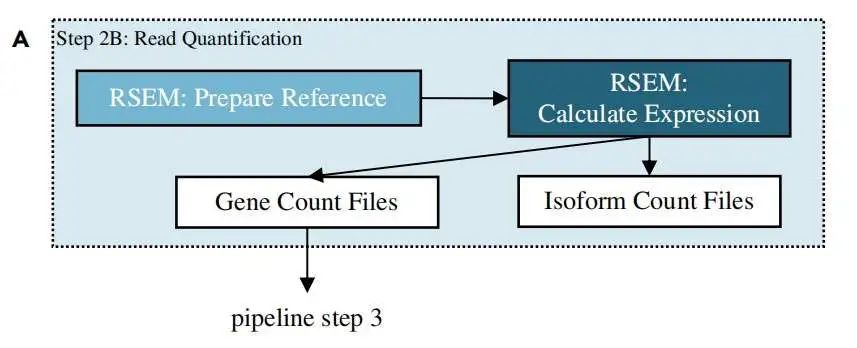
RSEM 定量需要先建立索引文件:
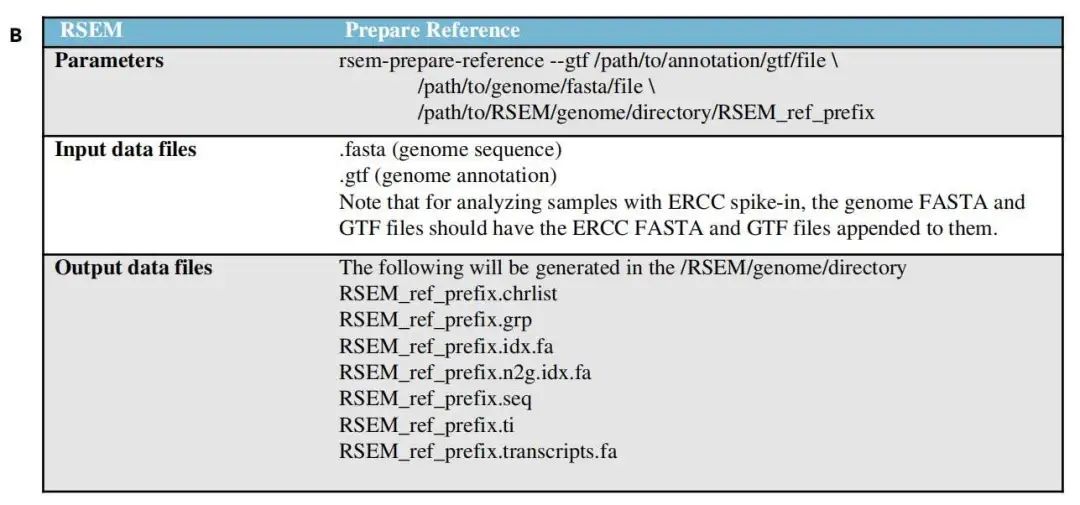
$ rsem-prepare-reference --gtf /path/to/annotation/gtf/file                            /path/to/genome/fasta/file
                          /path/to/RSEM/genome/directory/RSEM_ref_prefix
注意: 如果实验加入了
ERCC作为内参,则你的 基因组文件 和 注释文件 也应该加入 ERCC 的相应信息。
定量:
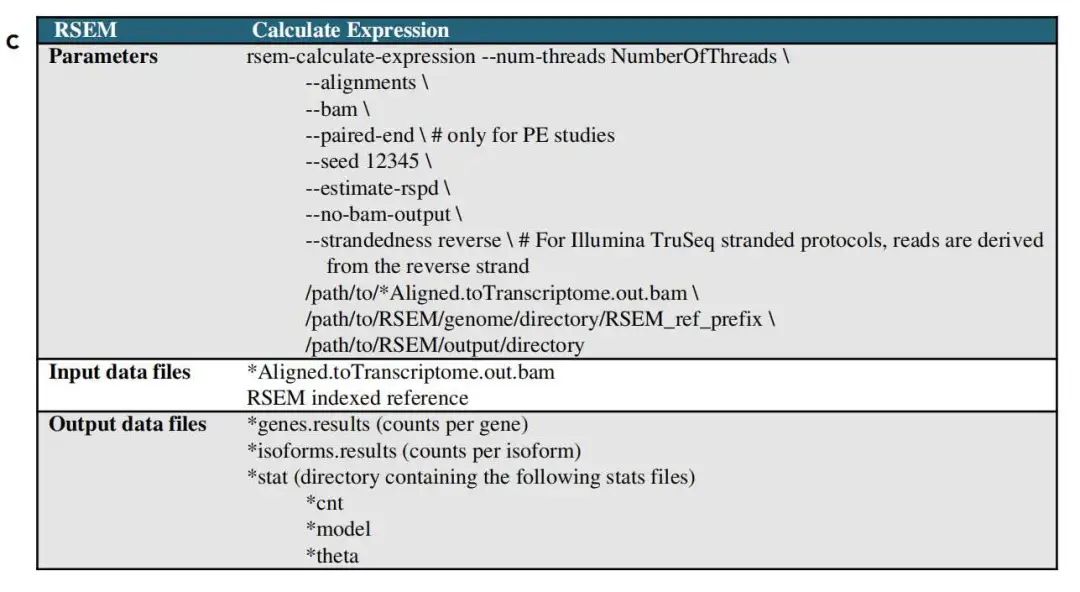
$ rsem-calculate-expression --num-threads NumberOfThreads                              --alignments
                            --bam
                            # only for PE studies
                            --paired-end
                            --seed 12345
                            --estimate-rspd
                            --no-bam-output
                            # For Illumina TruSeq stranded protocols, reads are derived from the reverse strand
                            --strandedness reverse
                            /path/to/*Aligned.toTranscriptome.out.bam
                            /path/to/RSEM/genome/directory/RSEM_ref_prefix
                            /path/to/RSEM/output/directory
差异分析
拿到定量的 基因或者转录本定量文件 后,就可以根据自己的实验分组设计进行差异分析了,这里用的是 DESeq2 软件:
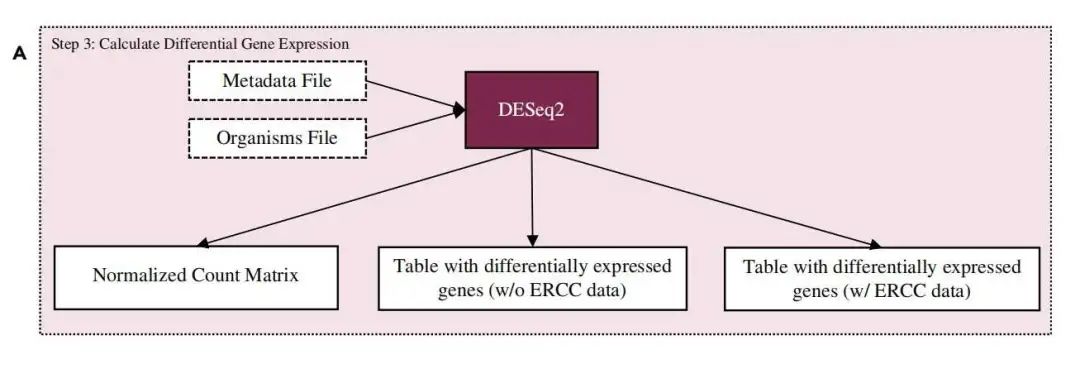
这里粘贴一个小鼠物种的差异分析代码:
library(tximport) library(DESeq2) library(tidyverse)

organism <- "MOUSE" work_dir="/path/to/GLDS-137/processing_scripts/04-05-DESeq2_NormCounts_DGE" counts_dir="/path/to/GLDS-137/03-RSEM_Counts" norm_output="/path/to/GLDS-137/04-DESeq2_NormCounts" DGE_output="/path/to/GLDS-137/05-DESeq2_DGE" setwd(file.path(work_dir))

study <- read.csv(Sys.glob(file.path(work_dir,"*metadata.csv")), header = TRUE, row.names = 1, stringsAsFactors = TRUE) ##### Group Formatting if (dim(study) >= 2){
 group<-apply(study,1,paste,collapse = " & ") # concatenate multiple factors into one condition per sample } else{
 group<-study[,1]
}
group_names <- paste0("(",group,")",sep = "") # human readable group names group <- make.names(group) # group naming compatible with R models names(group) <- group_names
rm(group_names) ##### Contrast Formatting contrasts <- combn(levels(factor(group)),2) # generate matrix of pairwise group combinations for comparison contrast.names <- combn(levels(factor(names(group))),2)
contrast.names <- c(paste(contrast.names[1,],contrast.names[2,],sep = "v"),paste(contrast.names[2,],contrast.names[1,],sep = "v")) # format combinations for output table files names contrasts <- cbind(contrasts,contrasts[c(2,1),])
colnames(contrasts) <- contrast.names
rm(contrast.names) ##### Import Data files <- list.files(file.path(counts_dir),pattern = ".genes.results", full.names = TRUE)
names(files) <- rownames(study)
txi.rsem <- tximport(files, type = "rsem", txIn = FALSE, txOut = FALSE) # add 1 to genes with lengths of zero if necessary txi.rsem$length[txi.rsem$length == 0] <- 1 # make DESeqDataSet object sampleTable <- data.frame(condition=factor(group))
rownames(sampleTable) <- colnames(txi.rsem$counts)

dds <- DESeqDataSetFromTximport(txi.rsem, sampleTable, ~condition) # filter out genes with counts of less than 10 in all conditions keep <- rowSums(counts(dds)) > 10 dds <- dds[keep,]
summary(dds) #### Perform DESeq analysis dds_1 <- DESeq(dds) # export unnormalized, normalized, and ERCC normalized counts normCounts = as.data.frame(counts(dds_1, normalized=TRUE))
setwd(file.path(norm_output))
write.csv(txi.rsem$counts,file='Unnormalized_Counts.csv')
write.csv(normCounts,file='Normalized_Counts.csv')
write.csv(sampleTable,file='SampleTable.csv')

setwd(file.path(work_dir))

normCounts <- normCounts +1 dds_1_lrt <- DESeq(dds_1, test = "LRT", reduced = ~ 1)
res_1_lrt <- results(dds_1_lrt) 4结尾
所有的分析代码作者已经上传到 githup 上面了,感兴趣的小伙伴自行去下载查看:
https://github.com/nasa/GeneLab_Data_Processing/tree/master/RNAseq/GLDS_Processing_Scripts


转自:老俊俊的生信笔记
- 本文固定链接: https://maimengkong.com/zu/1091.html
- 转载请注明: : 萌小白 2022年7月2日 于 卖萌控的博客 发表
- 百度已收录
