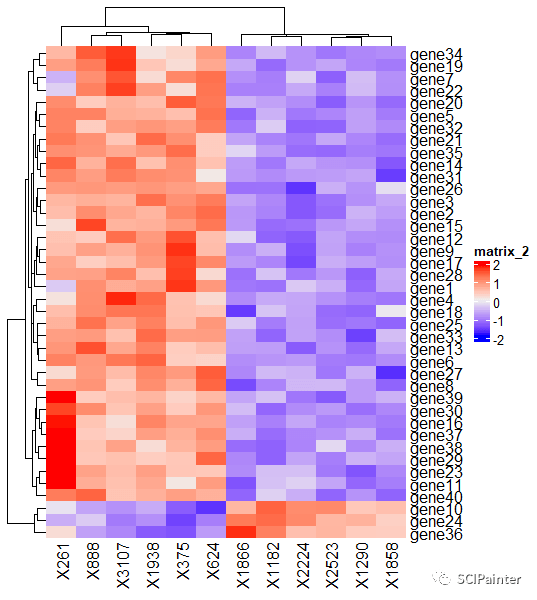
正常情况下,我们绘制的常规热图都是直直的,这样更便于我们进行数据的展示和阅读;
但上周收到小伙伴的问题:能不能把热图“卷”起来,绘制环状的热图?当然也是可以的,我们先看几个文献中的案例:
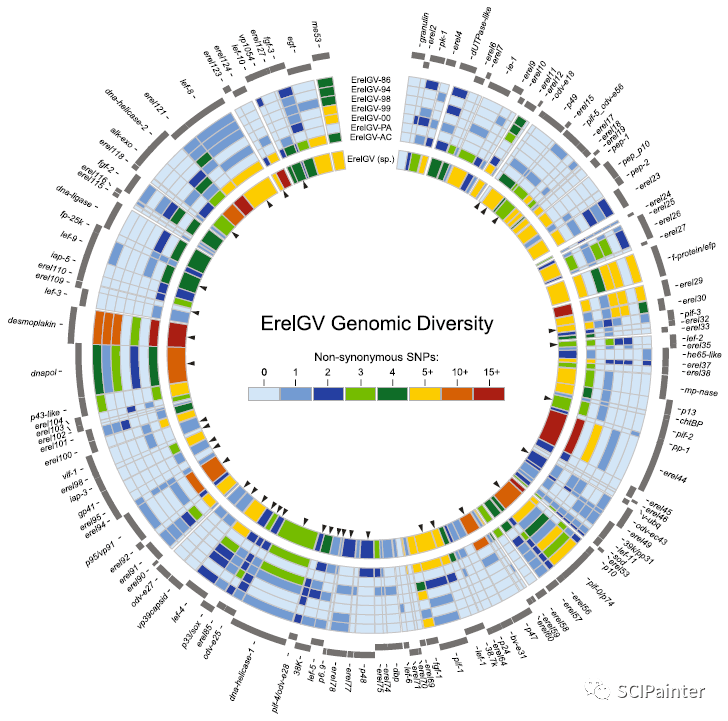
( BMC Genomics ,2018)
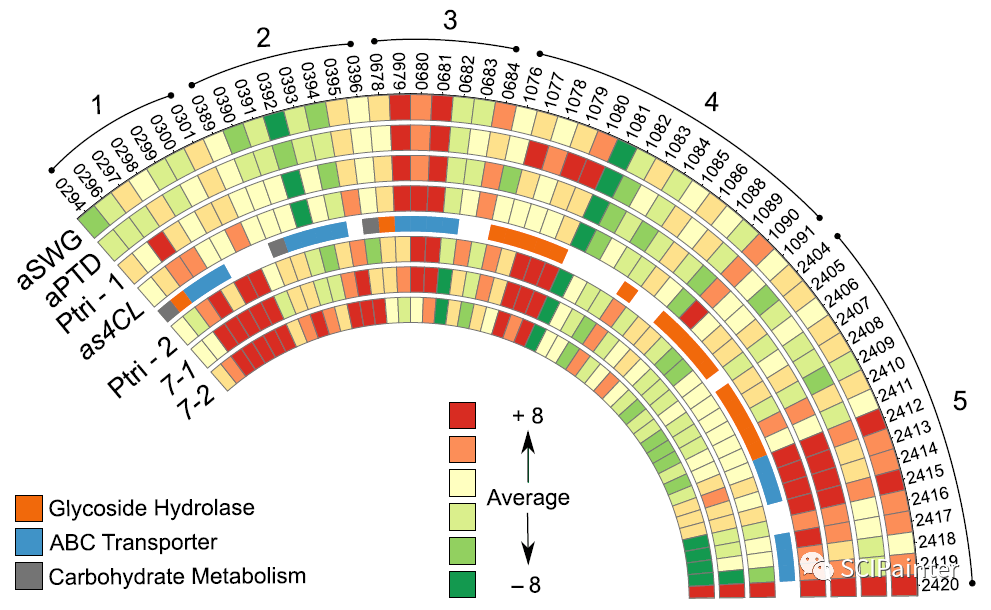
( Microbial Biotechnology , 2017)
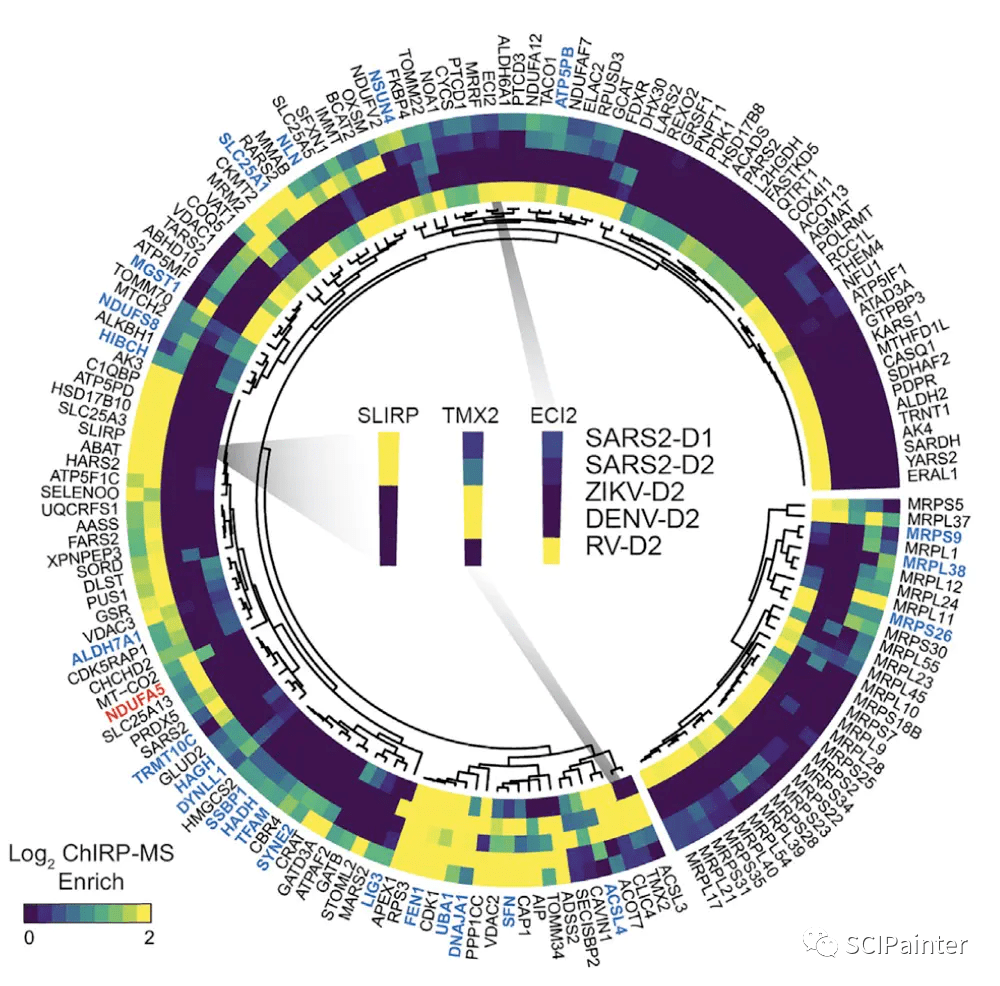
( Cell ,2021)
环状热图我们也经常会在论文中看到,用法和热图相同,但更适合于需要展示较多基因(数据)时来使用,这样我们团一团后可以既美观又省版面空间;不过一般情况还是建议使用常规热图哦。
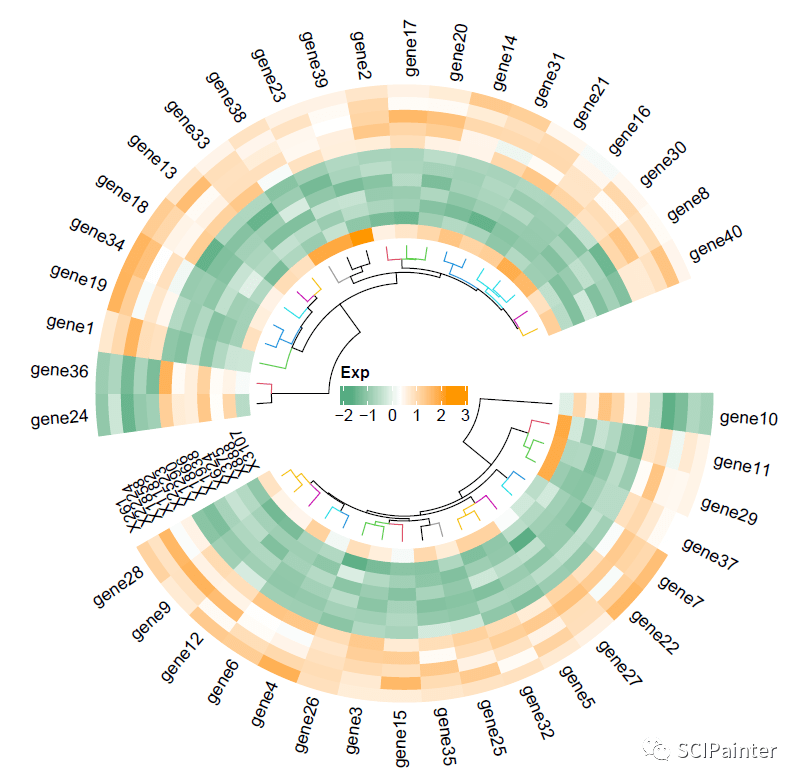
今天就给有需要要小伙伴们分享一下R语言绘制环状热图的方法,主要用到的ComplexHeatmap包绘制热图和circlize包中的circos.heatmap函数将热图从“直”拉“弯。”
#所需包的安装和载入:
install.packages( "circlize")
install.packages( "ComplexHeatmap")
library('ComplexHeatmap')
library('circlize')
#设置工作目录和载入本地数据:
setwd( "C:/Users/Desktop/环形热图")
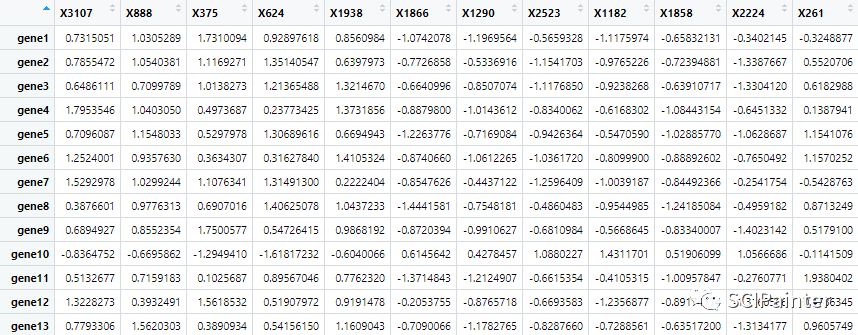
data<-read.csv( "circle heatmap eg.csv",header=T,row.names=1)
head(data)
#转化为矩阵并对其进行归一化:
madt<-as.matrix(data)
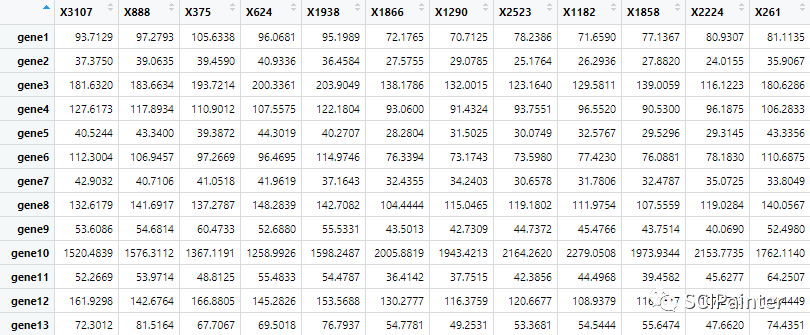
madt2<-t(scale(t(madt)))
#默认参数绘制普通热图
Heatmap(madt2)
#计算数据大小范围
range(madt2)
#重新定义热图颜色梯度:
mycol=colorRamp2(c(-1.7, 0.3, 2.3),c( "blue", "white", "red"))
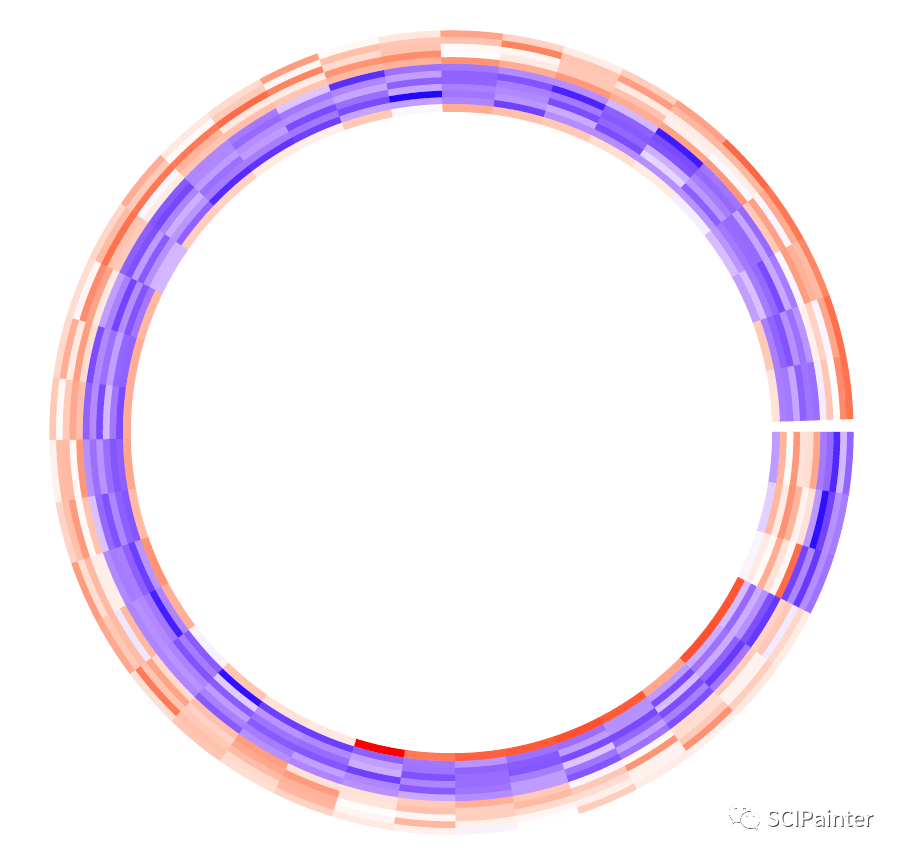
#绘制基础环形热图:
circos.heatmap(madt2,col=mycol)
circos.clear#绘制完成后需要使用此函数完全清除布局
#在circos.heatmap中添加参数进行环形热图的调整和美化:
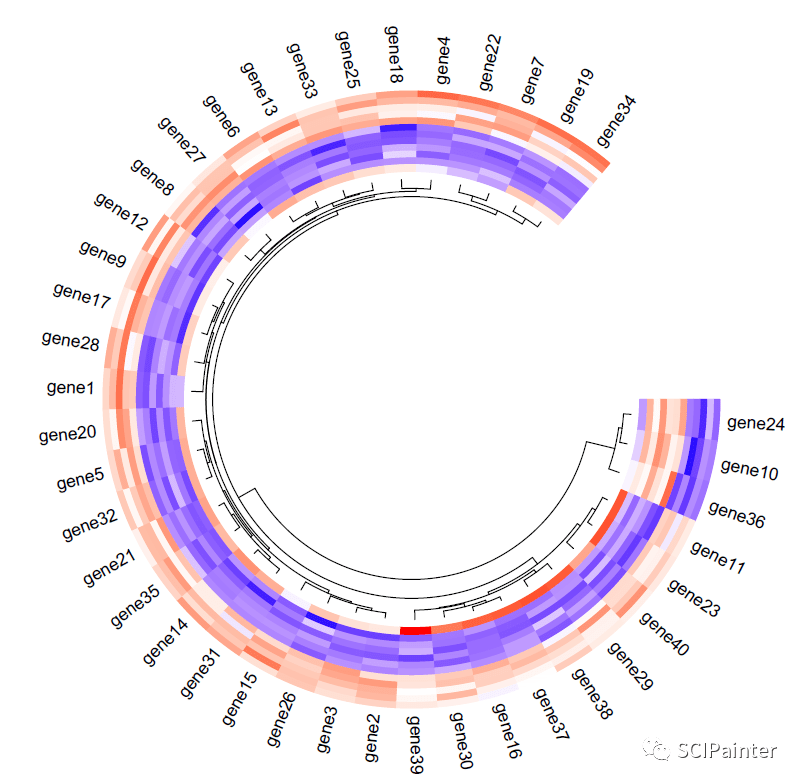
circos.par(gap.after=c(50))
circos.heatmap(madt2,col=mycol,dend.side= "inside",rownames.side= "outside",
rownames.col= "black",
rownames.cex=0.9,
rownames.font=1,
cluster=TRUE)
circos.clear
#circos.par调整圆环首尾间的距离,数值越大,距离越宽
#dend.side:控制行聚类树的方向,inside为显示在圆环内圈,outside为显示在圆环外圈
#rownames.side:控制矩阵行名的方向,与dend.side相同;但注意二者不能在同一侧,必须一内一外
#cluster=TRUE为对行聚类,cluster=FALSE则不显示聚类
#聚类树的调整和美化(需要用到两个别的包):
install.packages( "dendextend")#改颜色
install.packages( "dendsort")#聚类树回调
library(dendextend)
library(dendsort)
circos.par(gap.after=c(50))
circos.heatmap(madt2,col=mycol,dend.side= "inside",rownames.side= "outside",track.height = 0.38,
rownames.col= "black",
rownames.cex=0.9,
rownames.font=1,
cluster=TRUE,
dend.track.height=0.18,
dend.callback=function(dend,m,si) {
color_branches(dend,k=15,col=1:15)
}
)
circos.clear
#track.height:轨道的高度,数值越大圆环越粗
#dend.track.height:调整行聚类树的高度
#dend.callback:用于聚类树的回调,当需要对聚类树进行重新排序,或者添加颜色时使用
#包含的三个参数:dend:当前扇区的树状图;m:当前扇区对应的子矩阵;si:当前扇区的名称
#color_branches:修改聚类树颜色
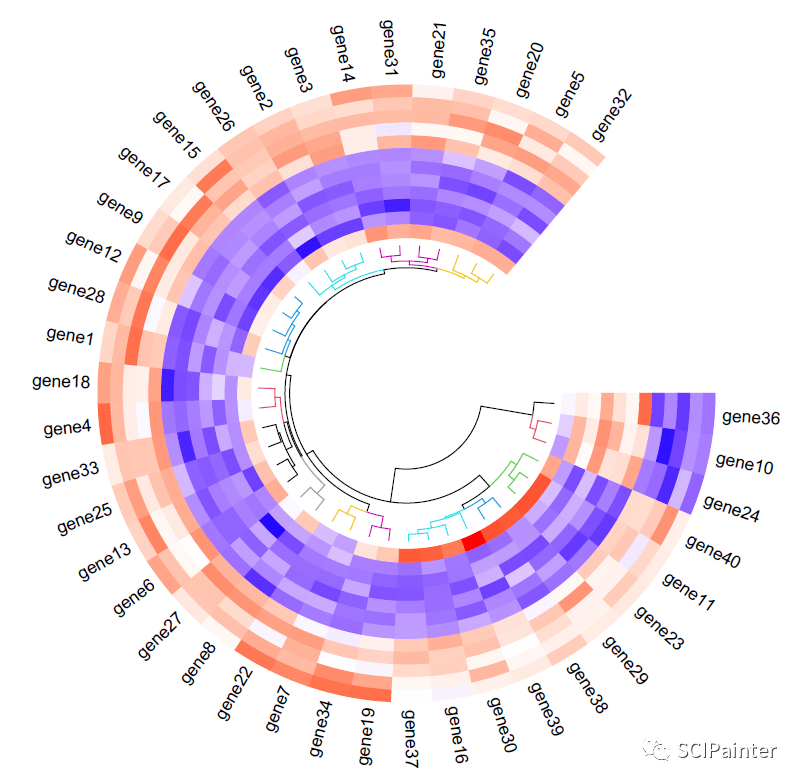
#添加图例标签等
lg=Legend(title= "Exp",col_fun=mycol,direction = c( "vertical"))
grid.draw(lg)
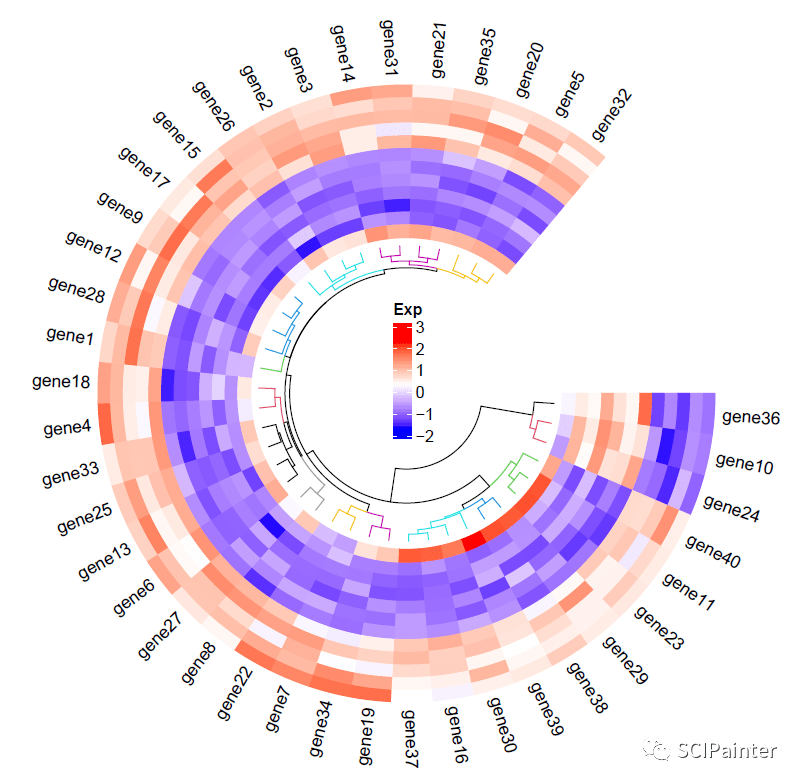
#添加列名:
circos.track(track.index=get.current.track.index,panel.fun=function(x,y){
if(CELL_META$sector.numeric.index==1){
cn=colnames(madt2)
n=length(cn)
circos.text(rep(CELL_META$cell.xlim[2],n)+convert_x(0.8, "mm"),#x坐标
7.8+(1:n)*1.1,#y坐标
cn,cex=0.8,adj=c(0,1),facing= "inside")
}
}, bg.border=NA)
circos.clear
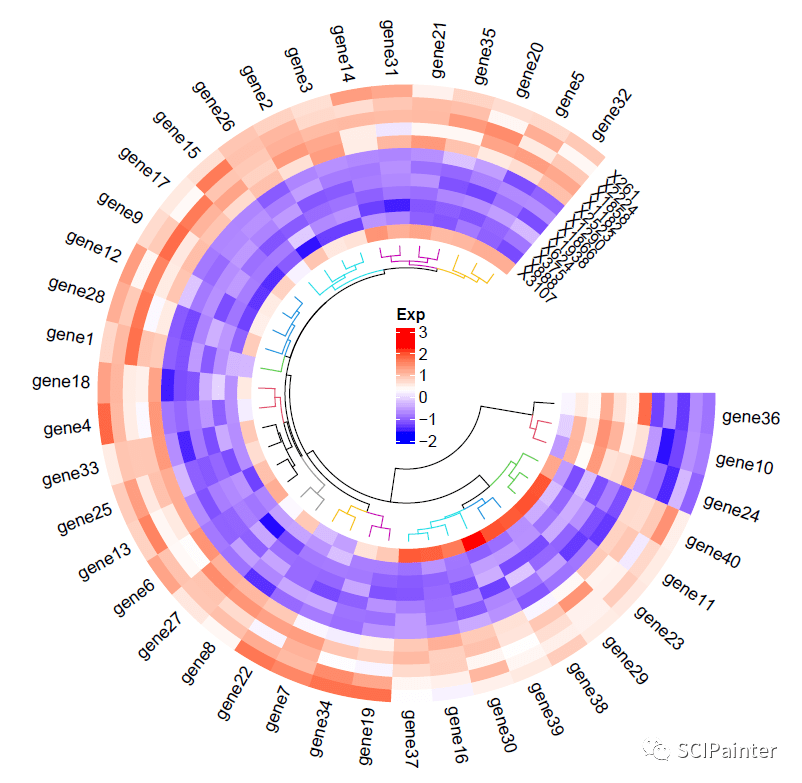
#更换热图配色,并重新绘图:
#这里代码和上文相同,仅改变了颜色和circos.par(圆环首位的距离)
mycol2=colorRamp2(c(-1.7, 0.3, 2.3),c( "#57ab81", "white", "#ff9600"))
circos.par(gap.after=c(22))
circos.heatmap(madt2,col=mycol2,dend.side= "inside",rownames.side= "outside",track.height = 0.38,
rownames.col= "black",
rownames.cex=0.9,
rownames.font=1,
cluster=TRUE,
dend.track.height=0.18,
dend.callback=function(dend,m,si) {
color_branches(dend,k=15,col=1:15)
}
)
lg=Legend(title= "Exp",col_fun=mycol2,direction = c( "vertical"))
grid.draw(lg)
circos.track(track.index=get.current.track.index,panel.fun=function(x,y){
if(CELL_META$sector.numeric.index==1){
cn=colnames(madt2)
n=length(cn)
circos.text(rep(CELL_META$cell.xlim[2],n)+convert_x(0.8, "mm"),#x坐标
7.8+(1:n)*1.1,#y坐标
cn,cex=0.8,adj=c(0,1),facing= "inside")
}
}, bg.border=NA)
circos.clear
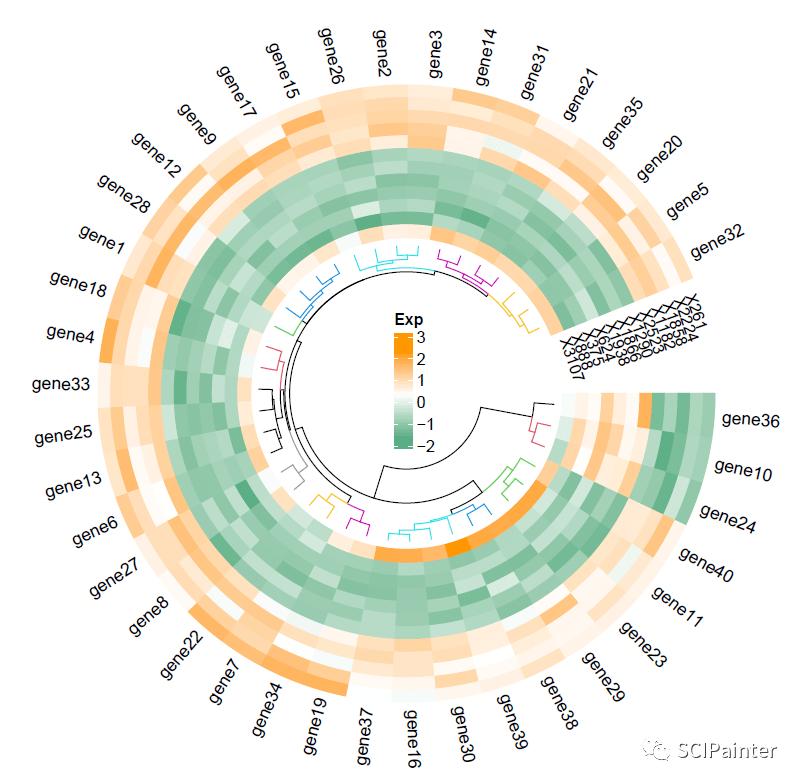
#分组热图绘制:
#circos.heatmap内只能是一个矩阵,但如果矩阵数据存在分组,可以用split参数来指定分类变量
split= sample(letters[1:2], 40, replace = TRUE)
split= factor(split, levels = letters[1:2])
circos.par(gap.after=c(22))
circos.heatmap(madt2,col=mycol2,split=split,dend.side= "inside",rownames.side= "outside",track.height = 0.38,
rownames.col= "black",
rownames.cex=0.9,
rownames.font=1,
cluster=TRUE,
dend.track.height=0.18,
dend.callback=function(dend,m,si) {
color_branches(dend,k=15,col=1:15)
}
)
lg=Legend(title= "Exp",col_fun=mycol2,direction = c( "horizontal"))
grid.draw(lg)
circos.track(track.index=get.current.track.index,panel.fun=function(x,y){
if(CELL_META$sector.numeric.index==1){
cn=colnames(madt2)
n=length(cn)
circos.text(rep(CELL_META$cell.xlim[2],n)+convert_x(0.8, "mm"),
7.8+(1:n)*1.1,
cn,cex=0.8,adj=c(0,1),facing= "inside")
}
}, bg.border=NA)
circos.clear
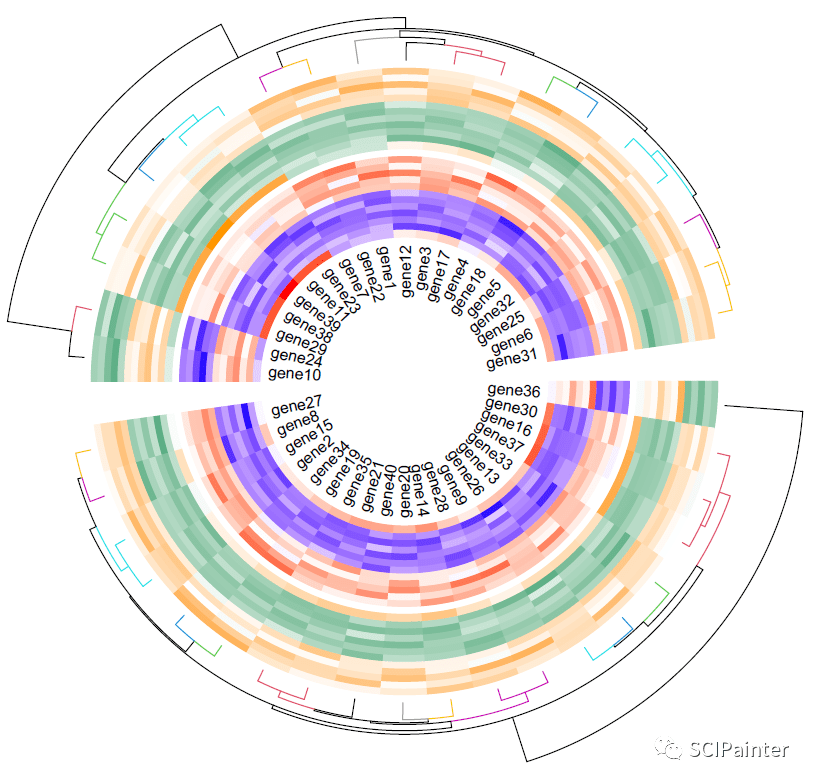
#多轨热图绘制:
#假设有两个热图的矩阵数据(这里仅为一组重复两次以作示范)
madt2<-t(scale(t(madt)))
madt3<-t(scale(t(madt)))
split2= sample(letters[1:2], 40, replace = TRUE)
split2= factor(split2, levels = letters[1:2])
circos.par(gap.after=c(8))
circos.heatmap(madt2,col=mycol2,split=split2,dend.side= "outside",
cluster=TRUE,
dend.track.height=0.2,
dend.callback=function(dend,m,si) {
color_branches(dend,k=15,col=1:15)
}
)
circos.heatmap(madt3, col = mycol,rownames.side= "inside",rownames.cex=0.8)#加入第二个热图
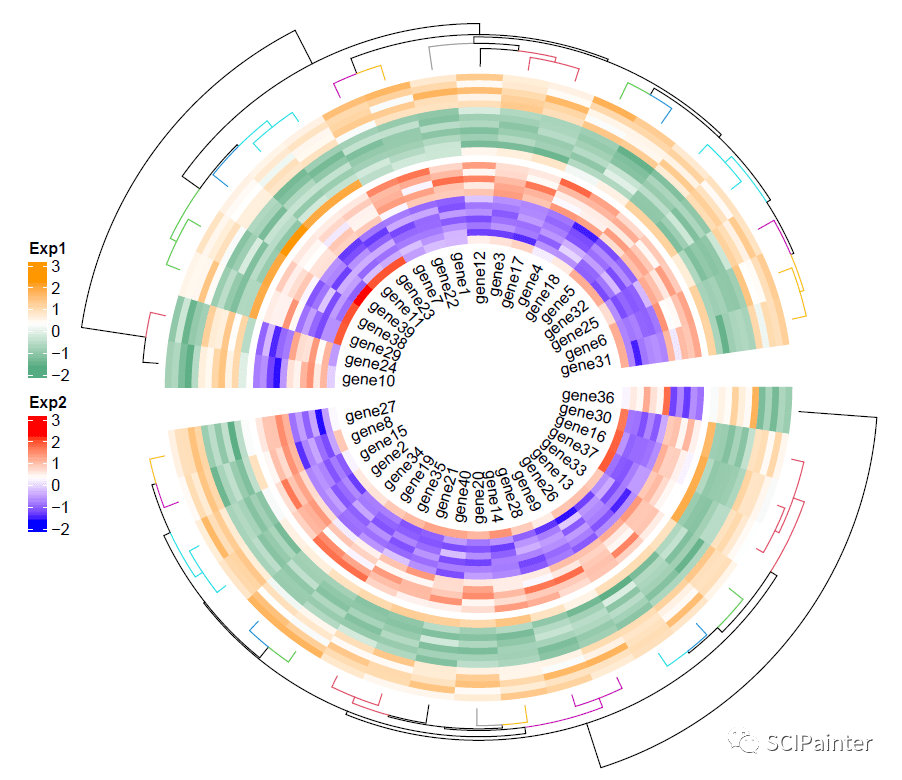
#添加放置在左侧的图例:
install.packages( "gridBase")
library(gridBase)
lg_Exp1=Legend(title= "Exp1",col_fun=mycol2,direction = c( "vertical"))
lg_Exp2=Legend(title= "Exp2",col_fun=mycol,direction = c( "vertical"))
circle_size= unit(0.07, "snpc")
h= dev.size
lgd_list= packLegend(lg_Exp1,lg_Exp2, max_height = unit(2*h, "inch"))
draw(lgd_list, x = circle_size, just = "left")
circos.clear
好啦,今天的分享就到这里~
如需要绘图数据,欢迎分享本图文到朋友圈,凭截图即可找客服领取啦!!
# SCIPainter
基迪奥旗下绘图公众号
分享科研绘图技能与工具
欢迎关注与转发~
你的好友拍了拍你
并请你帮她点一下“分享”~